How to read a nautical chart and its depth contours (without being a professional skipper)
A nautical chart is a map of what you cannot see: what lies under the water. Learning to read four things (soundings, depth contours, the datum and the seabed symbols) gives you most of what you need for a short trip.
Soundings: the small numbers at sea
Each blue or black number at sea is a sounding: the depth measured at that point, in metres on current Spanish charts (older ones may use fathoms). Two details trip up beginners:
- If the number has a subscript (for example 42), it means metres and decimetres: 4.2 m.
- A sounding says nothing about what lies between it and the next one. Between two 10 m numbers there can be a 2 m rock that nobody measured.
Depth contours: lines of equal depth
Depth contours (isobaths) are lines joining points of equal depth. They work like the contour lines on a mountain map, in reverse: reading them is reading the slope of the seabed.
- Lines packed close together: the bottom drops fast, like a wall. It can be a good place to find fish and cetaceans, but leaves little margin for anchoring.
- Lines far apart: the bottom is gentle, a plain that sinks slowly. Usually better for anchoring.
- A closed shallow circle: a shoal or a rock. Keep away, or approach with great care and the engine idling.
The blue shading, from lighter to darker, is the same information drawn differently: the lighter, the less water.
Chart datum: what depth is counted from
Soundings are not measured from today's sea level but from a reference level called chart datum, almost always the lowest predictable low-water level. EMODnet, for example, refers its depths to Lowest Astronomical Tide (LAT). In practice, with a normal tide there will almost always be more water than the chart shows, rarely less. In the Mediterranean the difference is a few tens of centimetres; in the Atlantic, metres.
Seabed and hazard symbols
Next to the soundings you will find abbreviations for the nature of the seabed, which matter more for anchoring than the number itself. The exact abbreviations depend on the chart (there are international and Spanish versions), so keep the chart's legend of symbols to hand. What they mean:
| Seabed type | For anchoring |
|---|---|
| Sand | Good: the anchor holds and comes up easily. |
| Mud | Good with a suitable anchor; hard to break out. |
| Gravel | Fair. |
| Rock | Poor: the anchor may snag or fail to hold. |
| Coral | Always avoid. |
Hazards (submerged rocks, shoals, wrecks) are drawn with crosses and asterisks. If you do not know a symbol, look it up in the chart legend: that is what it is for.
An official chart and an app's chart are not the same thing
An official chart is produced and certified by a hydrographic service (in Spain, the Instituto Hidrográfico de la Marina) from single-beam or multibeam surveys. It is the one with legal standing. Many apps, Embarca included, use something else: digital terrain models that interpolate surveys of varying quality. Four differences to keep in mind:
- Resolution. GEBCO's global grid has cells of 15 arc-seconds (about 460 m); EMODnet's for Europe, about 115 m. Each cell gives a single value.
- Origin. GEBCO distinguishes measured data from data predicted from satellite gravity or interpolated, and warns that its resolution may differ greatly from that of the underlying data. That is why it states it must not be used for navigation.
- Hazards. A digital model does not "know" what an isolated rock 30 cm wide is; an official chart marks it.
- Legal standing. Only the official chart has it. That is why Embarca repeats on every screen that it is estimated depth, not a sounder.
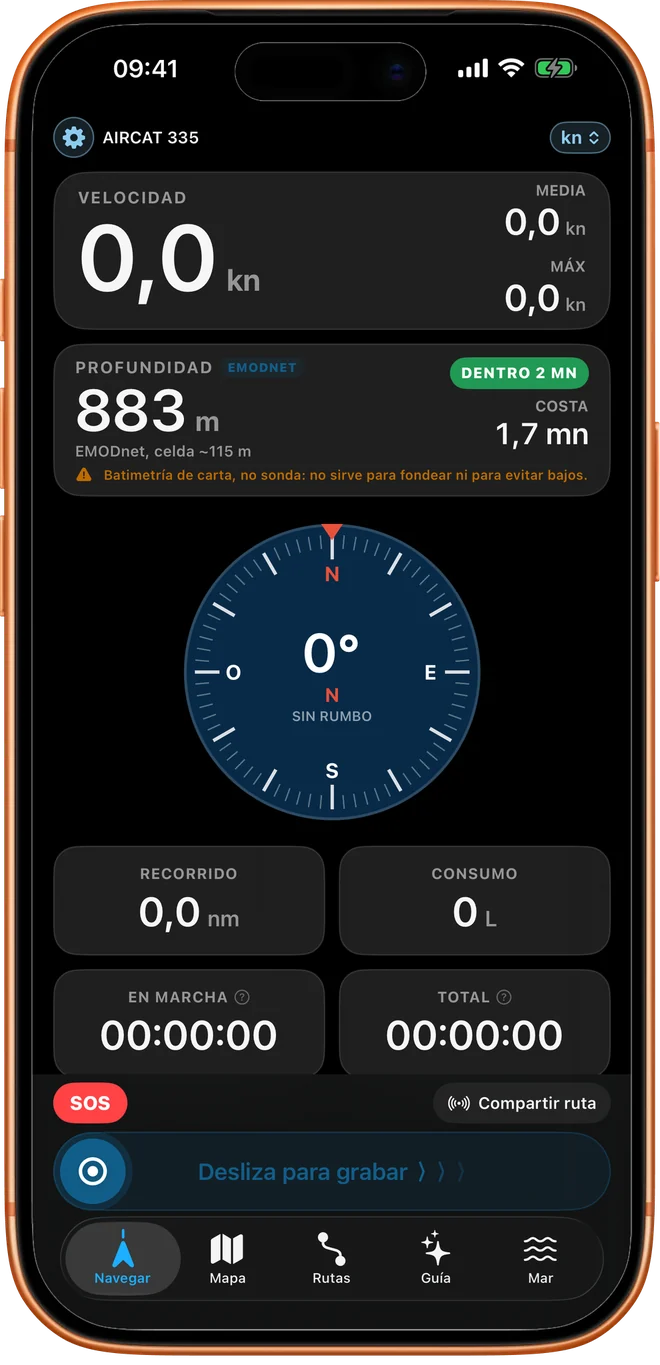
How to use an app's chart sensibly
- Use the shading and contours to rule out (very shallow water, bottoms that drop suddenly, marked shoals).
- To accept a spot, confirm it with your eyes, a lead line or a sounder. See how to anchor without a sounder.
- Remember that the closer to the coast and to shoals, the more matters what the grid does not show.
- Download the area before leaving if you will have no coverage: offline charts.
Sources
- GEBCO, global grid: 15 arc-seconds, classification of data (measured, indirect, unknown) and warning on navigation use.
- EMODnet Bathymetry: European digital model of 1/16 by 1/16 arc-minutes (about 115 m), referred to LAT.
- Instituto Hidrográfico de la Marina: official Spanish nautical charts.